Trusted data for tankers
The Baltic Exchange provides a complete picture of the tanker market through our daily physical and forward assessments, weekly Sale & Purchase and vessel recycling data, and quarterly benchmark of operating costs.
Our tanker information is independent and underpins physical and FFA contracts.
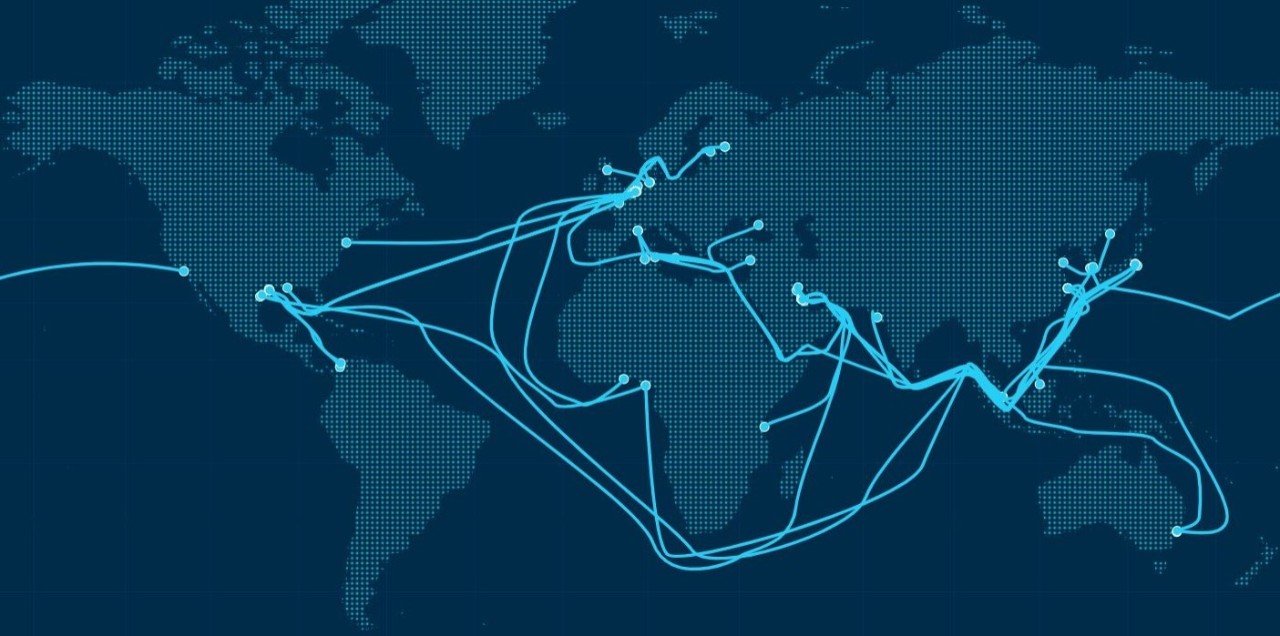
Click here to explore an interactive map of all our routes.
- VLCC to handysize tankers
- 35 key clean and dirty routes
- Worldscale and Time Charter Equivalent assessments
- Based on assessments by leading shipbrokers
Clean
TC1 - 75K Middle East Gulf to Japan
TC2_37 - 37K UK-Continent to US Atlantic Coast
TC5 - 55K Middle East Gulf to Japan
TC6 - 30K Algeria to European Mediterranean
TC7 - 35K Singapore to East Coast Australia
TC8 - 65K Middle East Gulf to UK-Continent
TC10 - 40K South Korea to North Pacific West Coast
TC11 - 40K South Korea to Singapore)
TC12 - 35K West Coast India to Japan
TC14 - 38K US Gulf to UK-Continent
TC15 - 80K Mediterranean to Far East
TC16 - 60K ARA to Offshore Lome
TC17 - 35K Middle East Gulf to East Africa
TC18 - 38K US Gulf to Brazil
TC19 - 37K ARA to West Africa
TC20 - 90K Middle East Gulf to UK-Continent
TC21 - 38K US Gulf to Caribbean
TC22 - 35K South Korea to Australia
TC23 - 30K ARA to UK-Continent
TC-24 - 38k US Gulf to West Coast South America
MR Atlantic Basket (TC2_37 TCE & TC14 TCE)
MR Pacific Basket (TC11 TCE & TC12 TCE)
Baltic Clean Tanker Index (BCTI): Average (TC1, TC2_37, TC5, TC6, TC16, TC23)*4.540991088
Dirty
TD2 - 270K Middle East Gulf to Singapore
TD3C - 270K Middle East Gulf to China
TD6 - 135K Black Sea to Mediterranean
TD7 - 80K North Sea to UK-Continent
TD8 - 80K Kuwait to Singapore
TD9 - 70K Caribbean to US Gulf
TD14 - 80K South East Asia to East Coast Australia
TD15 - 260K West Africa to China
TD18 - 30K Baltic to UK-Continent
TD19 - 80K Cross Mediterranean
TD20 - 130K West Africa to UK-Continent
TD21 - 50K Caribbean to US Gulf
TD22 - 270K US Gulf to China
TD23 - 140K Middle East Gulf to Mediterranean
TD25 - 70K US Gulf to UK-Continent
TD26 - 70K East Coast Mexico to US Gulf
TD27 - 130K Guyana to ARA
TD28 - 80K WC Canada to China
TD29 - 80K WC Canada to PAL
TD33 - 145K US Gulf to ARA
VLCC TCE (TD3C, TD15, TD22)
Suezmax TCE (TD6 & TD20)
Aframax TCE (TD7, TD8, TD14, TD19, TD25 & TD26)
Baltic Dirty Tanker Index (BDTI): RoundedSum(TD2*0.09090909090909091, TD3C*0.0909090909090909, TD6*0.0909090909090909, TD7*0.0909090909090909, TD8*0.0909090909090909, TD9*0.0909090909090909, TD14*0.0909090909090909, TD15*0.0909090909090909, TD18*0.0909090909090909, TD19*0.0909090909090909, TD20*0.0909090909090909)*8.415737054
Sale & Purchase
Weekly assessments for a five-year old vessel type for:
VLCC (305,000 dwt)
Suezmax (158,000 dwt)
Aframax (115,000 dwt)
MR Product Tanker (51,000 dwt)
Recycling
Weekly assessments of in US $/Lightweight for tankers. Delivery in Bangladesh, India & Pakistan
Large Tanker 30,001+ LDT
Medium Tanker 15,001-30,000 LDT
Small Tanker 7,000-15,000 LDT
OPEX
A quarterly index tracking the daily vessel operating costs for Aframax and MR product carriers.
The Baltic Operating Costs Index – Tanker (TOPEX) is calculated using crewing, technical and insurance costs. Published quarterly, the assessment is based on assessments by leading third party ship managers.
A five-year old dry dock cost, amortised over five years, is published separately.