BAI Index November 2026: Air freight rates surge past previous peak season highs as jet fuel prices soar

Air freight rates continued to rise through October as the market entered its traditional peak season period in the run-up to Thanksgiving in the United States and Christmas in Europe.
The global Baltic Air Freight Index (BAI00) calculated by TAC Data rose by +5.3% over the four weeks to 2 November. That left it at +22.8% year-on-year (YoY), well above the very highest points of the previous two peak seasons, with several more weeks of the traditional peak period yet to run.
While the global index numbers are quite striking, it is far from the whole story on the state of the market. Trends in jet fuel prices, combined with strong demand for semiconductors and other AI-related equipment, point to the possibility of a further surge in rates as peak season reaches its climax.
While the global index numbers are quite striking, it is far from the whole story on the state of the market. Trends in jet fuel prices, combined with strong demand for semiconductors and other AI-related equipment, point to the possibility of a further surge in rates as peak season reaches its climax.
As of late October, crude oil prices were well over $100 per barrel, up about +75% from the previous year. However, jet fuel was up much more, at +112.8% in the year to 30 October, according to the IATA Jet Fuel Price Monitor.
This reflected the considerable loss of refining capacity and distribution capabilities this year following the conflict in the Middle East between the US and Israel on one side and Iran and its proxies on the other. That has been exacerbated by the conflict in Eastern Europe, with Ukraine increasingly effective at hitting Russia’s oil and gas infrastructure.
As a result, the ‘crack spread’ between the price of crude oil and refined products like diesel and jet fuel has widened dramatically (by +238% YoY according to the latest IATA numbers, based on Platts data).
For much of the year, the impact of lower supply of both crude and refined products has been softened by a sharp reduction in China’s imports – by up to 5 million barrels per day (bpd) according to some reports, as well as by the release of substantial amounts of crude from the US Strategic Petroleum Reserve (SPR).
By late October, the SPR had fallen to 282.6 million barrels, only 40% of capacity and at its lowest level since 1982 when global consumption was only around 15 million bpd.
Consumption has since grown to over 100 million bpd, making the reserve much smaller now in relation to the size of the market. Meanwhile, sources are reporting that, since August, China’s imports have been starting to rise again.
Meanwhile, air freight rates have already been looking strong, not least on some of the biggest lanes out of Asia.
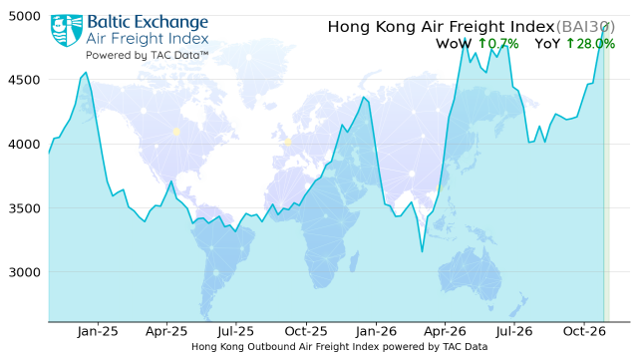
The full index of outbound routes from Hong Kong (BAI30) – reflecting the whole spectrum of spot and forward rates from the world’s biggest airport by cargo volume – was up +10.7% over the four weeks to 2 November, leaving it ahead by +28.0% YoY. By the end of October, BAI Spot rates out of Hong Kong – reflecting more precisely the marginal price being paid – were up by close to +35% YoY on Transpacific lanes to the US.
The full index of outbound routes from Hong Kong (BAI30) – reflecting the whole spectrum of spot and forward rates from the world’s biggest airport by cargo volume – was up +10.7% over the four weeks to 2 November, leaving it ahead by +28.0% YoY. By the end of October, BAI Spot rates out of Hong Kong – reflecting more precisely the marginal price being paid – were up by close to +35% YoY on Transpacific lanes to the US.
Spot rates were up much less on lanes to Europe where capacity and volumes have reduced sharply since July after the old de minimis exemption was scrapped for small parcels entering the EU.
BAI Spot from HK to the US East Coast surged from HK$51.84 per kilo on 30 September to HK$63.02 by 30 October. From HK to the US West Coast jumped from HK$46.17 per kilo to HK$56.99 between the same dates. HK to Europe saw a more modest rise from HK$35.42 to HK$40.84.
The full index of outbound routes from Shanghai (BAI80) was similarly up +12.3% over four weeks to 2 November, leaving it ahead by a more modest +14.4% YoY. However, BAI Spot numbers out of Shanghai, which more accurately reflect the marginal prices, were also rising much more strongly.
Meanwhile, rates were up from other hubs in East Asia like Seoul and Taiwan, driven by demand from the so-called ‘hyperscalers’ for semiconductors, processors and other equipment related to the AI/data centre boom.
Rates from hubs in Southeast Asia, such as Hanoi and Bangkok, were also well up YoY, continuing to benefit from a shift in the last year or two towards more ‘China plus one’ supply chain solutions. Meanwhile, rates from India were up around +80% YoY.
Rates from Europe were looking pretty firm as well, driven by gains on Transatlantic routes and other key lanes including to China, where cuts in capacity on Asia-Europe since July appear to have also helped pull up rates in the opposite direction. The index of outbound routes from Frankfurt (BAI20) gained +2.2% over the four weeks to 2 November, leaving it ahead by some +25.7% YoY.
Rates from Europe were looking pretty firm as well, driven by gains on Transatlantic routes and other key lanes including to China, where cuts in capacity on Asia-Europe since July appear to have also helped pull up rates in the opposite direction. The index of outbound routes from Frankfurt (BAI20) gained +2.2% over the four weeks to 2 November, leaving it ahead by some +25.7% YoY.
The more volatile outbound London Heathrow index (BAI40) fell sharply at the end of October to leave it lower by -4.6% over the same four weeks, but was also still well up YoY at +34.4%.
Rates from the Americas were a bit more mixed, with some lanes – such as from Miami to South America and from Mexico to Europe – continuing to be higher YoY. However, the index of outbound routes from Chicago (BAI50) also dropped off sharply towards month-end to leave it at only +17.9% YoY.
Meanwhile, from a global macro perspective, despite all the ongoing geopolitical frictions and turmoil, markets continued to be buoyed by soaring levels of investment in the AI sector, at least until a sudden sell-off at month-end led by a sharp drop in the share price of Alphabet (Google).
Overall equity index numbers were also disguising an ever greater concentration in the largest tech stocks, formerly led by the so-called Magnificent 7, but increasingly defined as a ‘Mag 10’, augmented by the addition of Broadcom, Palantir and AMD; or OpenAI, Anthropic and SpaceX. Overall, the rest of the market was getting de-rated and declining.
With many of these huge tech players cancelling share buybacks and/or coming to market to raise billions more through equity and debt issues, this has also been causing significant pressure on market financing capacity.
Whether or when this boom becomes a bubble and then a bust remains to be seen. In the meantime, this huge hyperscaler credit and data centre project finance has been competing increasingly keenly with other areas – from private credit to sovereign bonds – for effectively the same finite pool of investment capital.
With oil prices high and rising, and thus inflation and interest rates rising too, all of this has also put a renewed focus on high levels of sovereign debt in many big developed economies, including the US, France and the United Kingdom.
Of those three, the US has currently the highest debt-to-GDP ratio at around 125%, compared with France at close to 120% and the UK at just over 100%.
However, the US – for now at least – also has much the highest nominal growth, narrowly exceeding its 10-year Treasury debt yield, making its debt levels at least look more sustainable.
The UK by contrast has nominal growth now some way below its 10-year yield, while France is now a long way below, placing it in a potential ‘doom loop’ where lack of growth leaves debt interest swallowing an ever greater proportion of government spending and GDP.
The UK, at least, has flexibility to allow its currency to devalue and increase nominal growth – and so erode that debt-to-GDP ratio. However, markets are starting to see a riot-hit France, being tied to the euro, as much closer to a potential default, assisted by a European Central Bank restructuring much as Greece was after the global financial crisis.
With all of that potentially on the horizon, air cargo markets are, for now, running at full tilt into peak season.
Going forward TAC is also in the process of adding various new dimensions to the service – including TAC Explorer, providing guidance on rates for hundreds of additional lanes, as well as AI-driven reports to help explore the characteristics of each individual lane tracked. Stay tuned for more details.
Neil Wilson, TAC Editor
Neil Wilson is Editor of TAC Index, which provides independent, accurate and actionable global air freight data, allowing our customers to make comparative, cost-effective and intelligent air freight decisions.
Neil has more than 30 years’ experience in financial journalism and publishing, specialising mainly in derivatives and alternative investments. He has contributed to various publications including The Financial Times, The Economist and Risk magazine. He has also been a guest speaker at many industry events.
Neil has a B.A. with Honours in Philosophy, Politics and Economics from the University of Oxford.
Receive monthly air freight market reports direct to your inbox.